Path to instrumentation
Data-driven decision through a design-driven, user-focused process
Through this work, we enabled the IBM Guardium Insights product team to obtain readable data visualizations within Amplitude, giving cross functional teams visibility into valuable and actionable insights, ultimately improving user experiences and enabling teams to confidently experiment and deliver with speed.
Along with this instrumentation, we created a workflow enabling teams across IBM to accomplish instrumentation and experimentation through a user-focused lens.
Limited Visibility into User Behavior: Server-side instrumentation existed, but teams had no way to track what users clicked on or how they behaved within products.
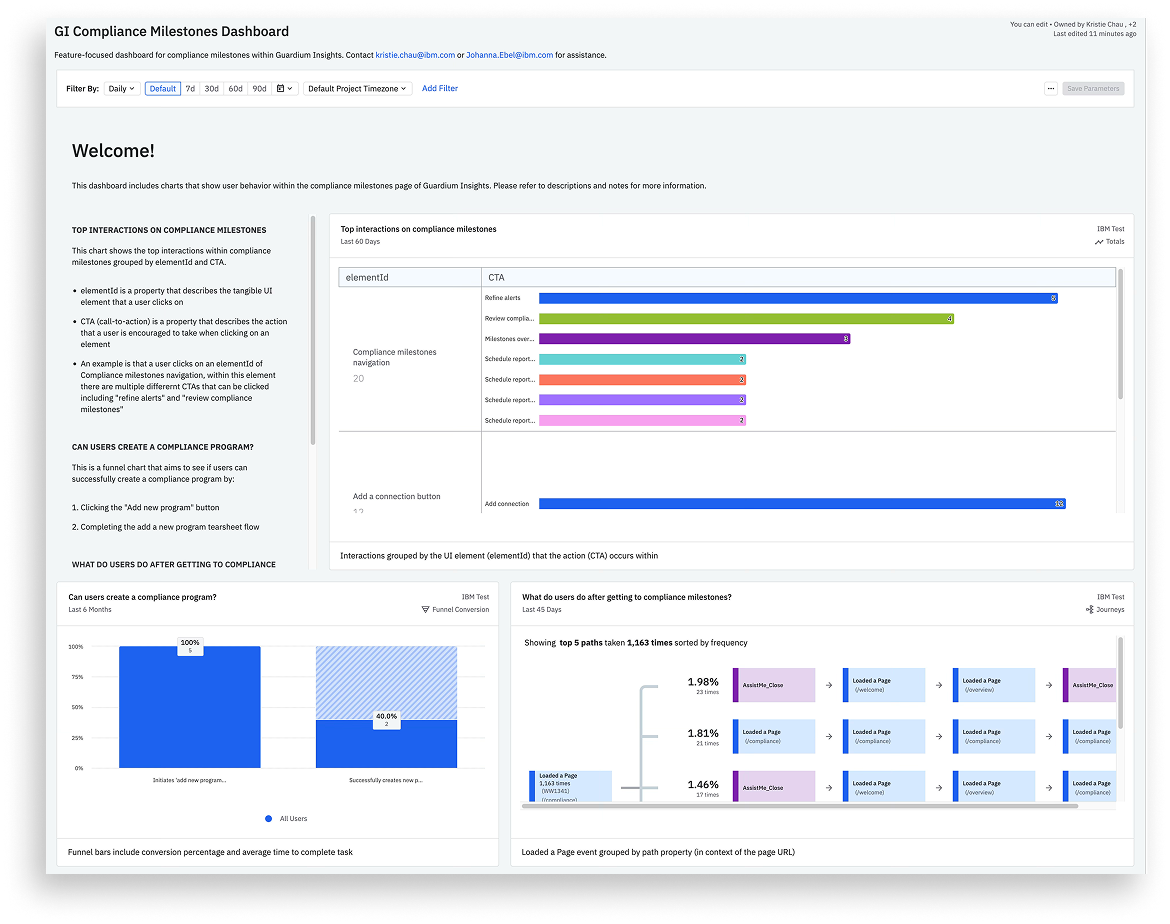
Unclear insights: Guardium Insights data in Amplitude was difficult to interpret and not actionable.
Missed Opportunities to Leverage Data: The Guardium Insights team wanted to tell a story within the data that could be easily understood and utilized to improve their product.
Widespread Problem Across IBM: Many teams faced similar issues with instrumentation. While data collection was happening, it often failed to address the core question: How are users interacting with our product?
Manual and Disconnected Process: The current instrumentation process was quite manual, and there was a disconnect between how data was intended to be used, what we needed to learn about users, and how data surfaced within Amplitude.
Delays in Data-Driven Experimentation: Without clear insights, design and development iterations were slow, requiring months of research to obtain quantitative data instead of enabling rapid, user-informed experimentation.
Challenge
Business Outcome
Implementing comprehensive instrumentation, readable data within Amplitude is a catalyst for cultural change in that it gives us the ability to
Monitor our North Star metrics, always
Accelerate our user's time to value when reaching their Ahas and Wows
Having this data at our fingertips enables us to:
Increase our speed to delivery by effectively collaborating with our XIAB
Inform experimentations confidently
Guide users to value, strategically
Streamline developer resources by reducing their effort
Obtain quantitative data immediately, in real time
This impact spanned beyond Security:
Delivered the Event Tracking Template, a reusable asset for all teams to utilize across IBM, sanctioned and adopted by IBM’s PLG team
Our input and feedback helped to improve IBM-wide instrumentation documentation and processes
Phase 1 & 2
How did we start getting data to flow into Amplitude?
First, we captured events
1.6 K events
3 months
Why so many events?
Capturing this level of UI events helps to keep a user-focused perspective and collect data on everything that happened between entry and success on their path to value, as well as where they may have dropped off.
More data gives us the flexibility to answer all we might need within Amplitude.


First, each event has a code snippet.
Before we got into the weeds of writing code, a skillset I had minimal experience with, we first needed to figure out: How the heck do you write a code snippet? We had asked this question many times, but the answer was always simple: Use this one-pager for guidance on properties.
Well, it turns out that was as clear as mud.
Sure, we can use the property action, but what values should be assigned to that aside from just ‘clicked’?
So, like many times throughout this project, we tapped Jeff Longshore to school us on writing code. The last thing we wanted to do was write thousands of incorrect (and unusable) code snippets and have no data flowing into Amplitude.
We aligned on a format and wrote out a few code snippets together. Next, we did a trial page and asked Jeff to review. He gave us the green light, and Kristie and I hit the ground running. 🙌🏼
How did we write events?

Project management + Stakeholder alignment

Phased approach
In order to align with our XIAB stakeholders and align with each other, we needed to approach this from a phased approach – to set expectations, align on projected (and realistic) deadlines, and set intent for what we needed to do in order to make this project complete.
Progress tracker
We were closely aligned with our developers on this deliverable. We knew we needed to deliver ASAP. As design was wrapping up sections of the Guardium Insights project, we were adding in the ready files as we finished them up so dev could start while we had moved on to the next one. Our goal was to expedite this process as much as possible.
Developer hand-off: Copy & Paste


Step One
The developer referenced the tracking object on our Figma Documentation
Step Two
The developer matches the tracking object to the code snippet and copies the code snippet.

Step Three
The developer pastes our code snippet into the code base, making that UI event visible in Amplitude.
This saved our developer time
Our devs mentioned that this method saved them a significant amount of time in that they didn’t have to spend time doing what design did in Phase 1, which was to identify the UI event and document the code snippet.
And, it’s simple enough for any dev to achieve
They stated that this methodology was simple enough for any developer to achieve, at any level, and that a developer doesn’t necessarily need to be familiar with the product to achieve instrumentation with this type of documentation available.
Identifying pain points + Addressing them
It was essential to workshop how to make this process less painful for everyone. While we achieved a lot, did something that hadn’t been done before, we needed to get input on how to make this more consumable.
We got together everyone who was involved from the start - our devs, IBM’s instrumentation team, took another deep dive into this process.
After this workshop, we learned so much about what could be better.

Solution: Improvements made to the Event Tracking Template
After stress testing the original event tracking template and workshopping with our developers, we updated the template to help streamline focus for each phase of implementation.
Getting the events into Amplitude shouldn’t be lumped in with measuring user success in Amplitude.
In this iteration, we:
Modeled how the Guardium Team delivers their redlines to developers to aid in its adoption. We didn’t want to reinvent the wheel.
Focused only on the code snippet for event capture: We received feedback from our devs that this streamlined their process. When they are copying and pasting code snippets, the goal of the workflow is not relevant to them.
Separated “Amplitude documentation” to help document what teams were trying to measure. Same thing - this was getting in the way of our developers and was a totally separate task for us. It made sense to make this a separate section.
This template can be used by teams in a continuous workflow or by teams starting from zero.
Phase 3
How did we create a story within Amplitude?
“Excellent application of instrumentation and using it to give insight into user activity. Would love for this to become habitual.”
Adam Case, Head of Product, IBM Carbon Design System
Start with a question
We learned a lot along the way. Some lessons we wish we knew earlier on the process, but thankfully, we captured them in our workshop and gave guidance to future designers to learn from our mistakes.

Takeaway 1
Values and properties directly affect how data is filtered and shaped in Amplitude.
Takeaway 2
While alignment with XIAB partners on what you want to measure within your product is important, it’s not essential for you to lock down before you start getting data flowing into Amplitude.
The possibilities for how you discover and shape the story of user behavior are endless once that data is flowing into Amplitude.
Focus on the ultimate goal
Increasing readability of data for all disciplines
Getting the data to flow into Amplitude would have very little value without ensuring that our teams would be able to read it.

Problem
The current data was not telling a story within Amplitude.
Solution
Let questions on user behavior guide us.
Giving context and using plain language descriptions empowers everyone to read and interact with data, no matter their title or discipline.
Set goals with your Stakeholders

Adding documentation helps everyone align with your goal
In the template we created, we gave designers and template users step-by-step instructions on how to do this and aligned them on a common vernacular for measuring user success.
Phase 4
How are we getting people to adopt?
Our goal
To help teams get instrumented, stay instrumented, understand user behavior, allowing them to experiment with speed & to confidently build, iterate and create a paths to value within their products.
Our focused approach
To meet with teams that have instrumentation
As our products change, Instrumentation must evolve with them. We need designers to collaborate with their stakeholders using our method to ensure their products remain instrumented.
To meet with teams that have NO instrumentation
We helped many teams get started and construct the right teams to get their data flowing into Amplitude.
To play our instrumentation methodology to large audiences to promote adoption.
Instrumentation is a company-wide focus and is essential for focusing on growth and adoption of IBM products. We shared our approach as often as possible to PMs, the design org, and several teams throughout IBM.